











sdvplotR plots sports
team logos, wordmarks, player headshots and team colors across the 49
leagues of the SportsDataverse team index (sdv_leagues()) — NFL,
NBA, WNBA, MLB, NHL, college football, men’s and women’s college
basketball, soccer and more — in
ggplot2 plots,
gt tables and
reactable tables, and in
interactive plotly,
ggiraph and
leaflet charts and maps,
with playing surfaces (59 of them: every court, field, rink and sheet,
lacrosse, tennis, volleyball and curling included; the team leagues’
surfaces take a team’s colors) from
sportyR. It is built on
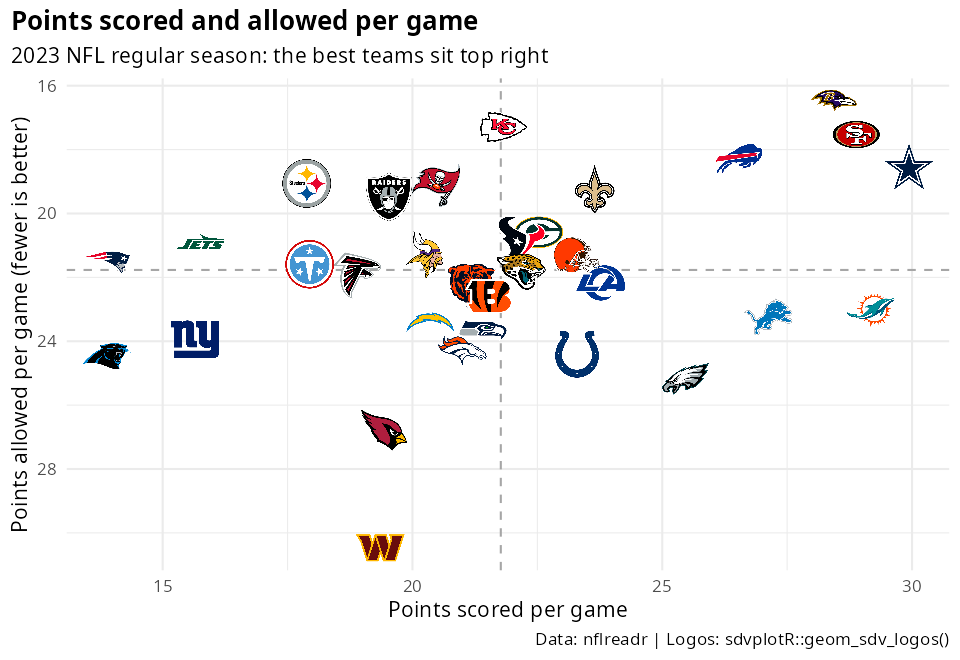
ggpath and unifies the
approach established by nflplotR,
cfbplotR,
nbaplotR and
mlbplotR behind one league
argument.
Part of the SportsDataverse family of R packages for sports analytics.
Data freshness and pipeline status for every SportsDataverse dataset: sportsdataverse.org/status.
Once on CRAN, install the released version with:
install.packages("sdvplotR")Install the development version of
sdvplotR from
GitHub with:
# using the pak package (recommended):
if (!requireNamespace("pak", quietly = TRUE)) {
  install.packages("pak")
}
pak::pak("sportsdataverse/sdvplotR")
# or from R-universe (binary builds):
install.packages("sdvplotR", repos = c("https://sportsdataverse.r-universe.dev", "https://cloud.r-project.org"))The same team colors, logos, wordmarks and headshots are on PyPI as
sdvplot (Python 3.10+), with
adapters for matplotlib and seaborn, plotnine, Plotly, Altair, Bokeh,
HoloViews, great_tables and folium. sdvplot.great_tables ports this
package’s table themes, cell styling, legends and image export. Docs:
sdvplot.sportsdataverse.org.
Source:
sportsdataverse/sdvplot.
pip install sdvplotThey are also on npm as
@sportsdataverse/sdvplot,
with Observable Plot, D3, React and chart-library integrations plus shot
charts.
@sportsdataverse/sdvtables
is the counterpart to the gt table helpers. Docs:
plot.sportsdataverse.org. Source:
sportsdataverse/sdvplot-js.
npm install @sportsdataverse/sdvplot @sportsdataverse/sdvtables @sportsdataverse/sportyEvery team-aware function takes a league argument ("nfl", "nba",
"wnba", "mlb", "nhl", "cfb", "mbb", "wbb", "soccer" and
the rest of sdv_leagues()). Team identifiers are resolved
automatically: full names, abbreviations from other data providers
(ESPN, nflverse, MLB Stats, nba_api, NHL, CFBD, NCAA and more) and the
codes of relocated franchises all resolve to the same team.
sdv_resolve() shows the id a value resolves to, sdv_suggest()
proposes candidates for a typo, and season selects the era for codes
that were reused.
library(sdvplotR)
library(ggplot2)

# NFL team logos in a grid
df <- data.frame(
  a     = rep(1:8, 4),
  b     = sort(rep(1:4, 8), decreasing = TRUE),
  teams = sdv_teams("nfl")$abbr
)

ggplot(df, aes(x = a, y = b)) +
  geom_sdv_logos(aes(team = teams), league = "nfl", width = 0.075) +
  theme_void()
# Logos as axis labels + team colours as fill
df2 <- data.frame(
team = c("KC", "BUF", "SF", "DAL"),
score = c(42, 38, 35, 30)
)
ggplot(df2, aes(x = team, y = score)) +
geom_col(aes(fill = team), show.legend = FALSE) +
scale_fill_sdv(league = "nfl") +
theme_minimal() +
theme(axis.text.x = element_sdv_logo(league = "nfl", size = 1))library(gt)
# Logos inside a gt table, in the SportsDataverse table theme
data.frame(team = c("KC", "BUF", "SF"), wins = c(13, 12, 11)) |>
gt() |>
gt_sdv_logos(columns = "team", league = "nfl") |>
gt_theme_sdv()
# ...or dressed in one team's colors
data.frame(player = c("Patrick Mahomes", "Travis Kelce"), yards = c(4183, 984)) |>
gt() |>
gt_theme_sdv_team(team = "KC", league = "nfl")library(reactable)
# Logos inside a reactable table with team-coloured bars
df3 <- data.frame(team = c("KC", "BUF", "SF"), wins = c(13, 12, 11))
reactable(
df3,
columns = list(
team = colDef(cell = reactable_sdv_logos(league = "nfl"), html = TRUE),
wins = colDef(style = reactable_sdv_team_color_bar(df3, "team", league = "nfl"))
)
)# Interactive: the logo grid again, each logo with a tooltip (ggiraph) ...
p <- ggplot(df, aes(x = a, y = b)) +
geom_sdv_logos_interactive(aes(team = teams, tooltip = teams, data_id = teams),
league = "nfl", width = 0.075
) +
theme_void()
ggiraph::girafe(ggobj = p)
# ... or logos on a native plotly chart (addSdvLogoMarkers() does maps)
plotly::plot_ly(df, x = ~a, y = ~b, type = "scatter", mode = "markers", text = ~teams) |>
add_sdv_logos(df$a, df$b, df$teams, league = "nfl")
# A playing surface painted in a team's colors, ready for shot or play data
sdv_surface("nba", team = "BOS")
# ... or any of 59 surfaces, lacrosse to curling: see the Surfaces cookbook
sdv_surface("nll")The Interactive Charts
cookbook
covers geom_sdv_logos_interactive() and its wordmark and headshot
siblings, add_sdv_logos(), sdv_axis_logos() and sdv_colorway() for
plotly, and addSdvLogoMarkers() for leaflet.
gt_theme_sdv() (light or style = "dark") and gt_theme_sdv_team()
are the SportsDataverse table themes. The gt side also carries the
gtUtils toolkit by Andrew
Weatherman: 18 table themes (gt_theme_kenpom(), gt_theme_savant(),
gt_theme_athletic(), …), color legends, cut lines, significance
notation, outlier flags, faceted grids and gt_save_crop() /
gt_social_crop() for publishing.
Dark-mode logo variants are available through variant = "dark" in the
reactable helpers (reactable_sdv_logos(variant = "dark")) and
sdv_logo_url(), and sdv_teams() exposes the full reference data
(ESPN ids, colors, conference) for every team.
The sdvplotR documentation
website has the full function
reference and every article; a selection:
🖼️ Browse the gallery: every article by its picture, each linking to the article that draws it.
Per-sport (each with companion SportsDataverse package examples): NFL · CFB · NBA · WNBA · MLB · NHL · MBB · WBB · Soccer
Cookbooks: Getting Started · Social Posting · Leaderboard Dashboards · reactable Integration · Workflows · Logos in ggplot2 · Colors and Themes · Interactive: plotly, ggiraph, leaflet · Surfaces and Shot Charts
Interactive (ggiraph, plotly and leaflet; every per-sport and leaderboard article also ends with an interactive version): NFL EPA Scatter · NBA Net Rating · NHL Shot Map · MLB Run Differential · CFB Stadium Map · Team Maps with leaflet
Tables cookbook: SportsDataverse Table Themes · Table Theme Registry · Team Tables with the gt Toolkit · reactable and reactablefmtr · Saving and Posting Tables · Tier Lists and six more gtUtils recipes
Recipes: NFL EPA Scatter · Head-to-Head Card · Rank Bump Chart · Rolling Form and eleven more
Leaderboards: NFL · CFB · NBA · WNBA · MLB · NHL
Automation: Social Graphics, Automated
The articles index lists all of them.
See also the function reference and the NEWS.
sportyRdraws the playing surfaces thatsdvplotRpaints in team colors.ggpathis the image engine underneath the logo and headshot layers.nflplotRandcfbplotRare the single-league packages whose conventionssdvplotRfollows.sdvplot(Python) and@sportsdataverse/sdvplot(JavaScript / TypeScript) are the twins in other languages.
sdvplotR draws the pictures; the companion packages fetch the data.
| Package | Sport / Scope |
|---|---|
| cfbfastR | College football |
| hoopR | Men’s basketball (NBA and NCAA) |
| wehoop | Women’s basketball (WNBA and NCAA) |
| fastRhockey | Hockey (NHL and PWHL) |
| baseballr | Baseball (MLB, MiLB, NCAA) |
| nflfastR · nflreadr | NFL play-by-play and data loaders |
| oddsapiR | Sports betting odds |
| cfbseedR | CFB seeding and playoff simulation |
| sportyR | Playing-surface plots |
| sportsdataverse-R | Umbrella R metapackage |
| sdvplot | Python plots and tables |
| @sportsdataverse/sdvplot · @sportsdataverse/sdvtables | JavaScript / TypeScript plots and tables |
| sportsdataverse-py · sportsdataverse.js | Python and Node.js |
See the full ecosystem at sportsdataverse.org.
Follow the SportsDataverse on X and star this repo










A printable four-page reference for sdvplotR: team logos, colors and scales in ggplot2, team identity, the plotly, ggiraph and leaflet integrations, surfaces, and the gt and reactable toolkits, in four color themes, light and dark.
📄 Download the sdvplotR cheat sheet (PDF)
Browse the other SportsDataverse cheat sheets at sportsdataverse.org/cheatsheets.
Please note that the sdvplotR project is released with a Contributor Code of Conduct. By contributing to this project, you agree to abide by its terms.
To cite the sdvplotR R
package in publications, use:
BibTeX Citation
@misc{gilani_carl_lee_kay_weatherman_sdvplotR,
  author = {Gilani, Saiem and Carl, Sebastian and Lee, Jared and Kay, Camden and Weatherman, Andrew},
  title = {sdvplotR: The SportsDataverse's R Package for Multi-League Sports Plotting.},
  url = {https://sdvplotR.sportsdataverse.org},
  year = {2026}
}sdvplotR is released under the MIT License; see
LICENSE.md.