


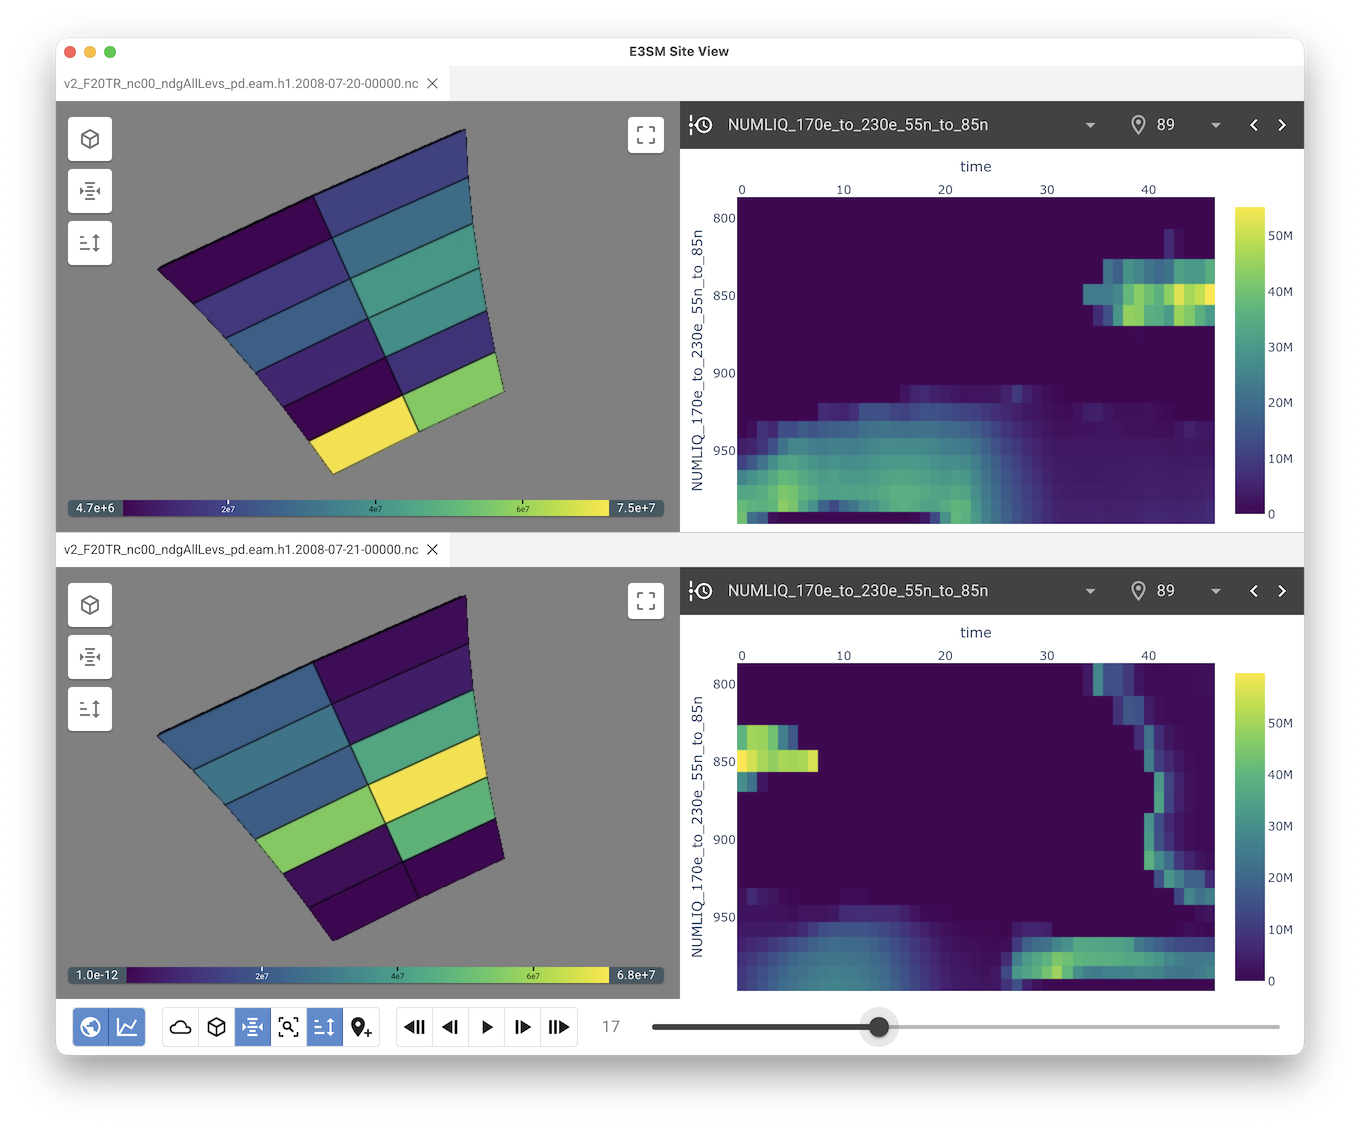
The SiteView UI presents an ARM observatory as a candidate location for in-depth analysis of simulation results. It extracts the E3SM atmosphere (EAM) columns around a site of interest and lets you explore how their fields evolve in space and time.
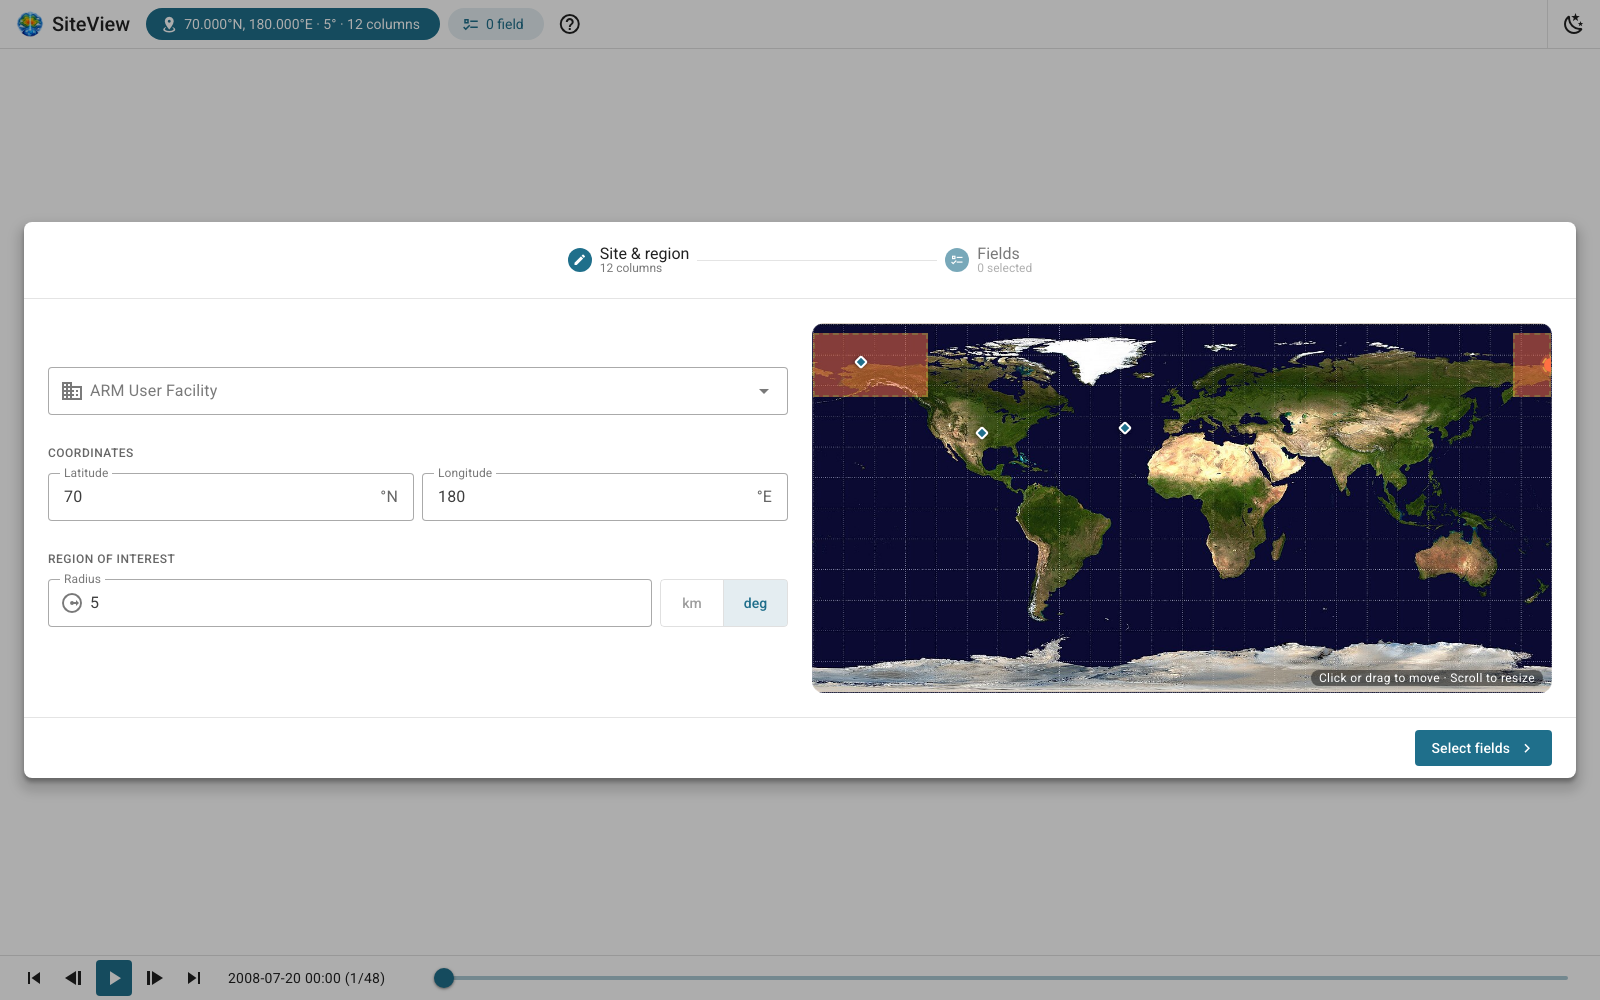
- Guided setup: pick the site (from the ARM user facilities or any latitude/longitude), the radius of the region of interest and the fields to load.
- 3D view of the selected columns with toggleable layers: clouds, vertical scaling, surface, volume, horizontal and vertical slices, find data, histogram, column cropping and probes. The view can be saved as an image.
- Column heatmap showing a field over vertical levels and time for a given column.
- Cell time charts comparing one or more fields across several columns over time.
- Heatmaps and charts can be downloaded.
- Time animation with play/pause and step controls across all the loaded files.
- Light and dark themes.
This library is open source and follows the Apache Software License. See LICENSE for details.
SiteView requires Python 3.10 or newer.
pip install e3sm-siteviewSiteView reads E3SM atmosphere (EAM) output in NetCDF format:
--cf: the connectivity file describing the horizontal mesh (SCRIP/TEMPEST format, e.g.connectivity_ne30pg2_TEMPEST.scrip.nc). Both global and regional meshes are supported, as long as they match the data files.--df: one or more EAM history files (e.g.*.eam.h1.*.nc) holding the fields to explore. When several files are given, each one gets its own panel and they all share a single time control. The time steps are read from the first file only: all the files are assumed to share the same time steps.
e3sm-siteview --cf ../data/connectivity.nc --df ../data/file_1.nc [...] ../data/file_n.ncFor example, with a regional dataset:
e3sm-siteview \
    --cf data/regional/connectivity_ne30pg2_170e_to_230e_55n_to_85n_TEMPEST.nc \
    --df data/regional/v2_F20TR_nc00_ndgAllLevs_pd.eam.h1.2008-07-*.nc
By default a browser tab opens on the application. Useful options:
| Option | Description |
|---|---|
--server |
Do not open a browser at startup (e.g. when running remotely) |
-p, --port PORT |
Port to serve the application on |
--host HOST |
Network interface to bind to (use 0.0.0.0 to allow remote access) |
--perf |
Print performance timing on stderr ([PERF] lines) |
Run e3sm-siteview --help for the full list of options.
Once the data is loaded, the following shortcuts are available (they are ignored while typing in a field or when a setup dialog is open).
| Key | Action |
|---|---|
Space |
Play / pause the time animation |
← / → |
Previous / next time step (hold to keep stepping) |
R |
Reset the camera |
1 - 9 |
Toggle the 3D view layers, in the order of the left toolbar |
0 |
Toggle the 10th layer (Probes) |
We recommend using uv for setting up and managing a virtual environment for your development.
# Create venv and install all dependencies
uv sync --all-extras --dev

# Activate environment
source .venv/bin/activate

# Install commit analysis
pre-commit install
pre-commit install --hook-type commit-msg
For running tests and checks, you can run nox.
# run all
nox

# lint
nox -s lint

# tests
nox -s testsThe examples directory contains standalone scripts that use the bundled EAM VTK readers
(e3sm_siteview.io) directly, without the UI: reading the mesh and column data, building the 3D column volume,
selecting columns within a radius and extracting time series.
See CONTRIBUTING.rst for how to contribute and CHANGELOG.md for the release history.
- Training: Learn how to confidently use trame from the expert developers at Kitware.
- Support: Our experts can assist your team as you build your web application and establish in-house expertise.
- Custom Development: Leverage Kitware’s 25+ years of experience to quickly build your web application.