
Finding the story in the data.

Hi 👋 I'm Harshvardhan, a B.Tech Electronics & Computer Engineering student who turns raw data into decisions. I work with Python, SQL and Power BI on forecasting, customer analytics and data warehousing, and I'm especially interested in finance analytics and data infrastructure.

|

|

|

|
| Project | What it covers |
|---|---|
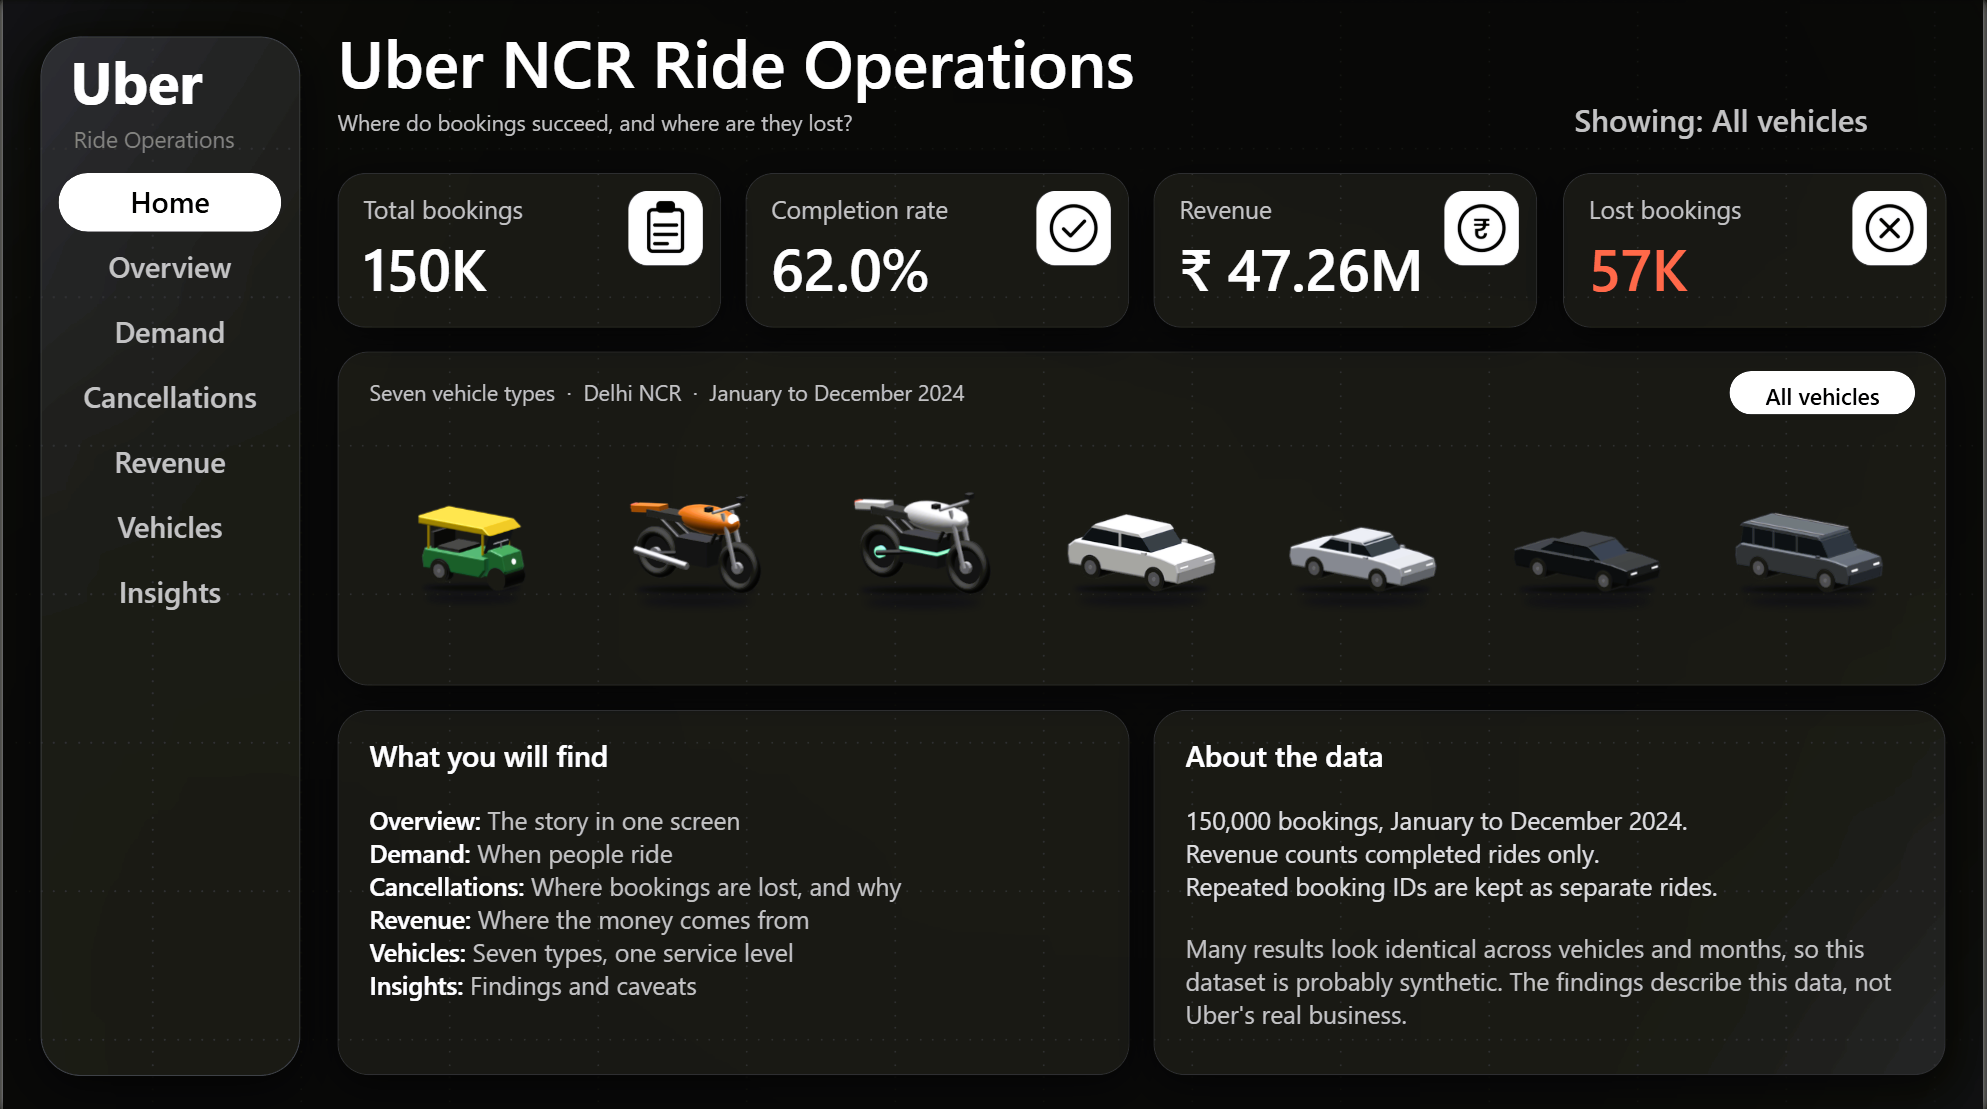
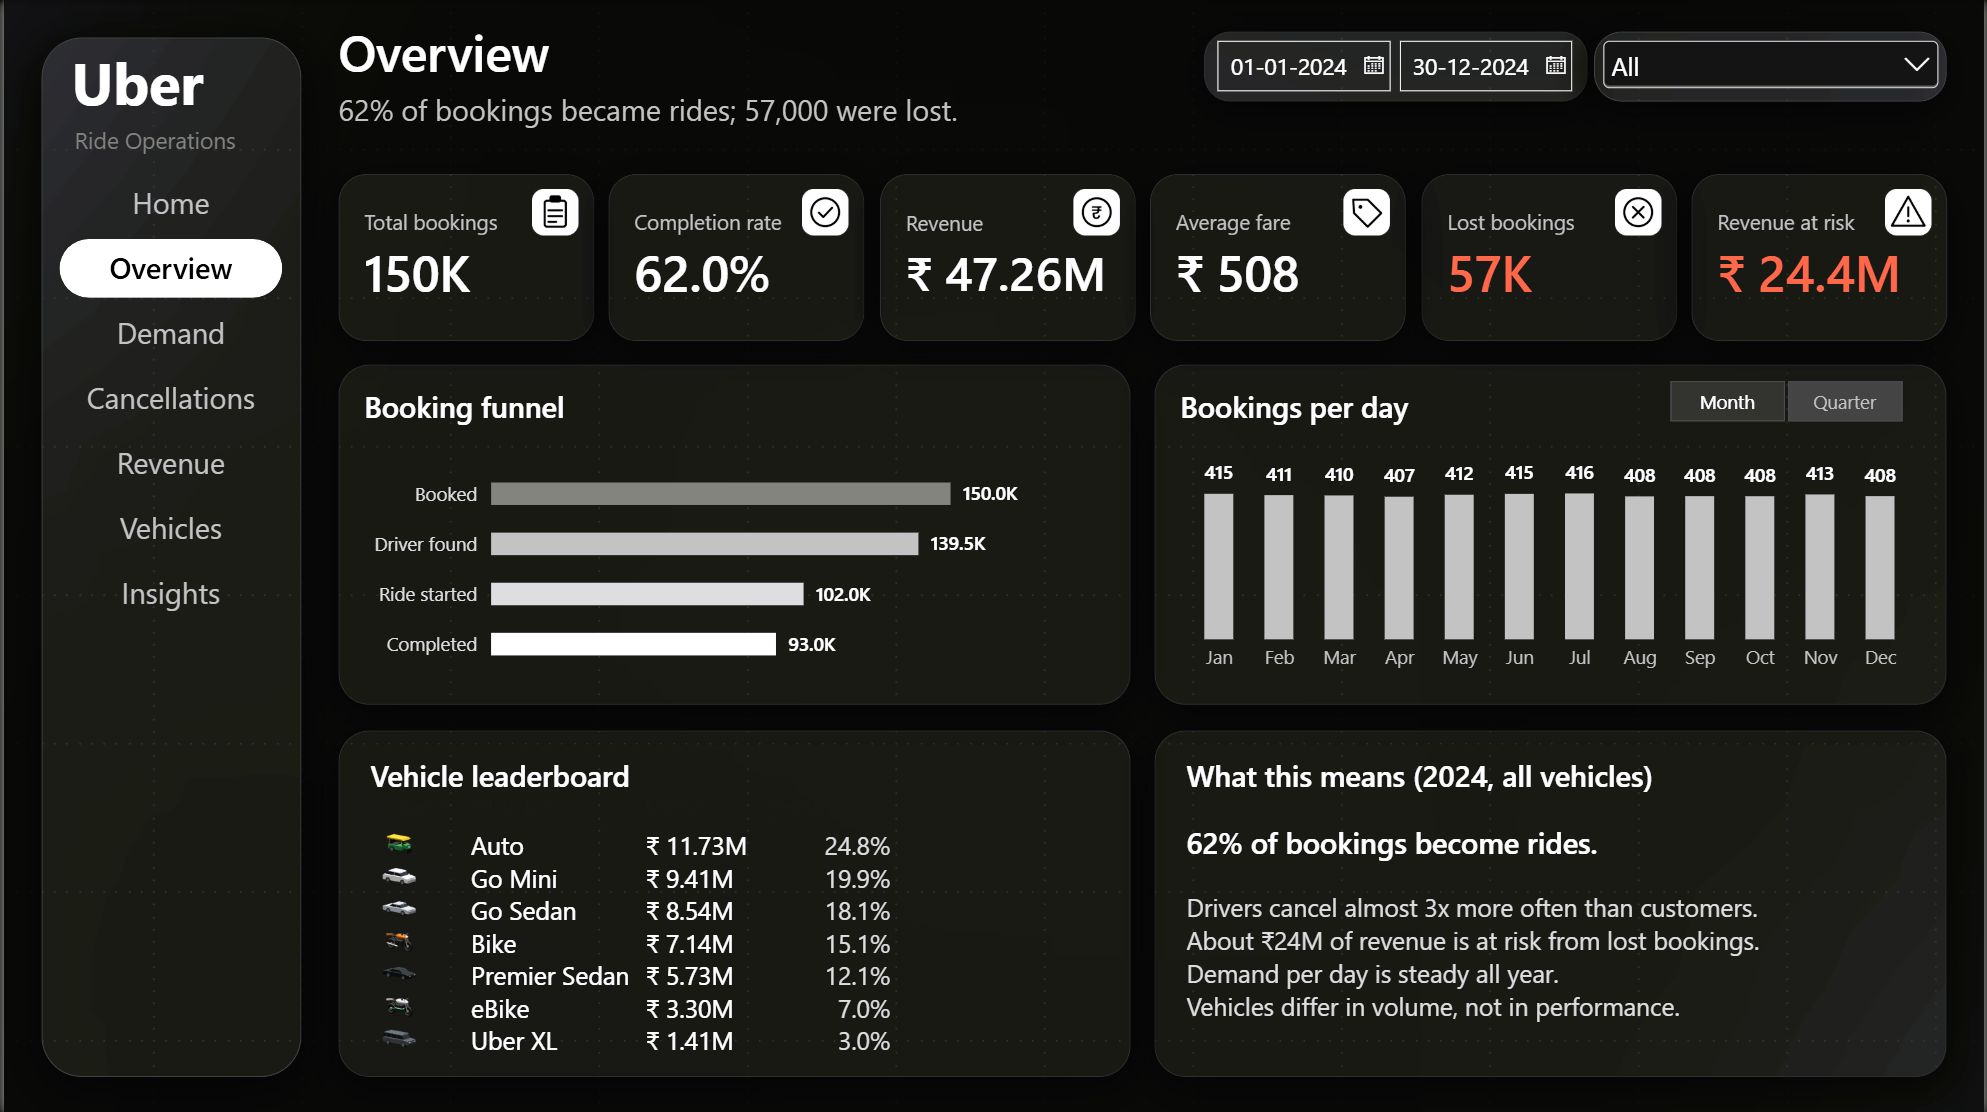
| Uber NCR Ride Operations | Python cleaning and audit of 150,000 NCR ride bookings, a Power BI star schema and a 7-page interactive dashboard on where bookings succeed and where they are lost |
| Financial Operations Analytics | Revenue forecasting, churn prediction and customer clustering on 5 years of simulated SaaS data, with a focus on finding and fixing data leakage |
| Retail & Marketing Analytics | RFM segmentation, customer lifetime value and cohort retention across 10,000 retail orders |
| E-Commerce Analytics Warehouse | Real Olist Brazilian e-commerce data cleaned in Python, modelled as a star schema with SQL, and presented in a 6-page deep-green Power BI dashboard |












| Certification | Issued by | Completed | ID |
|---|---|---|---|
| Registered Scrum Basics™ | Agile Education, powered by Scrum Inc. | Oct 8, 2026 | RSB-5234667 |
| AWS Cloud Practitioner Essentials | AWS Training & Certification | Oct 12, 2026 | n/a |
| Data Analytics Essentials | Cisco Networking Academy | Sep 30, 2026 | Credly badge |
Where do ride bookings succeed, and where are they lost? 150,000 Delhi NCR bookings, from raw CSV to a 7-page interactive dashboard


| Scope | 150,000 ride bookings from Delhi NCR (Jan to Dec 2024), a public Kaggle dataset that appears synthetic, so findings describe this dataset and not Uber's real business |
| Key findings | • Only 62.0% of bookings became completed rides: 57,000 of 150,000 were lost • Drivers cause 72% of cancellations (18.0% of all bookings vs 7.0% for customers) • About ₹24.4M of revenue is at risk (estimate: 48,000 cancelled or no-driver bookings × ₹508 average fare) • 44% of customer cancellations cite driver behaviour (4,630 of 10,500) • Demand peaks at 18:00, 9.4x the quietest hour (12,397 bookings vs 1,321 at 04:00) • UPI is 45.0% of revenue; digital payments make up 75.1% • Vehicle types differ in volume, not performance: completion stays between 61.4% and 62.6% |
| Rigor | Found 1,233 booking IDs repeated across 2,457 rows, confirmed they were different rides and kept them all with a unique key. Audited ratings, fares, distances and outcome flags, and found fares do not follow distance (correlation 0.006), so revenue per km is not reported as a KPI |
| Dashboard | 7 pages (Home, Overview, Demand, Cancellations, Revenue, Vehicles, Insights) with a bookmark-driven fleet selector, synced date and vehicle filters, a month/quarter toggle and DAX-driven highlight rules |
| My contribution | Cleaned and audited the data in Python, built the star schema (DimDate, DimTime, DimVehicle and a 150,000-row Rides table) with DAX measures in Power BI, and designed the dashboard, theme, vehicle illustrations and icons myself |
End-to-end analytics on a simulated 5-year SaaS business: forecasting, churn, segmentation and retention


| Scope | 5,000 customers and 135,218 transactions (2020 to 2024), synthetic data with a planted usage-score → churn signal so every model could be checked against ground truth |
| Key findings | • $3.5M/year of revenue flagged at risk across 1,166 active customers above a 15% churn-probability threshold • The "At Risk" RFM segment holds $10.4M, more than "Champions" at $8.1M, so the most valuable customers are showing early warning signs • K-Means found behavioral segments that cut across pricing tiers instead of just mirroring plan price |
| Rigor | Caught a data leakage bug: the first churn models scored a suspicious 1.000 ROC AUC because recency_days, lifetime_months and transaction_count encoded the outcome. Rebuilt with genuine leading indicators for an honest 0.756 ROC AUC (Gradient Boosting). Cohort rankings exclude cohorts under 6 months old to avoid survivor bias |
| Forecasting | ARIMA and Prophet models reached 0.77% MAPE on held-out data |
| My contribution | Built the full pipeline in Python (forecasting, churn modelling, RFM, K-Means, cohort retention) and presented it in an interactive 5-page Power BI dashboard |
What a retail business's sales data says about its customers


| Scope | 10,000 orders from 1,986 customers, Jan 2022 to Feb 2023 (synthetic dataset) |
| Business snapshot | $1,078,670.98 revenue at an 18.4% profit margin, with an average order value of $107.87 and 10.9% of customers inactive for 180+ days |
| Key findings | • Identified 14% of customers (278 users) in the "At Risk" segment representing ~$194K in past revenue with average individual spends of $698 • Electronics ($328K) and Office Supplies ($321K) drive ~60% of total revenue • Discounting showed zero correlation with sales or profit (0.00 to 0.02), highlighting ineffective promotion spend |
| My contribution | Cleaned and explored the data, grouped customers by behaviour (RFM segmentation, lifetime value, cohort retention) across 4 notebooks, and built a 5-page Power BI dashboard: Executive Overview, Customer Segmentation, Sales Deep Dive, Cohort & Retention, Customer Value |
Real Olist Brazilian e-commerce data, from raw CSVs to a star schema and a 6-page dashboard


| Outcome | Rebuilt an earlier sample-data warehouse on the real Olist dataset, with a data audit and cleaning notebook, SQL scripts, and a 6-page Power BI dashboard: Executive Overview, Sales & Revenue Trends, Products & Categories, Customers & Retention, Orders & Fulfilment, Insights & Recommendations |
| My contribution | Audited and cleaned the data in Python, designed the star schema and SQL, and built the dashboard layout, deep-green theme and icon set myself |
Safe money transfers under concurrent load

| How it works | • Atomic debits, credits and transaction logging inside a single conn.begin() block with automatic rollback on failure• Non-negative balances enforced at database level with a CHECK (balance >= 0) constraint |
| Outcome | A ledger designed to prevent race conditions, balance inconsistencies and negative balances during multi-threaded concurrent transfers, tested under READ COMMITTED and SERIALIZABLE isolation levels |
| My contribution | Wrote the schema (schema.sql), the transfer logic (transfer.py) and a concurrency test (concurrency_test.py) |


